Hi Equan,
It's probably possible - Totara is designed to adapt to your reporting needs!
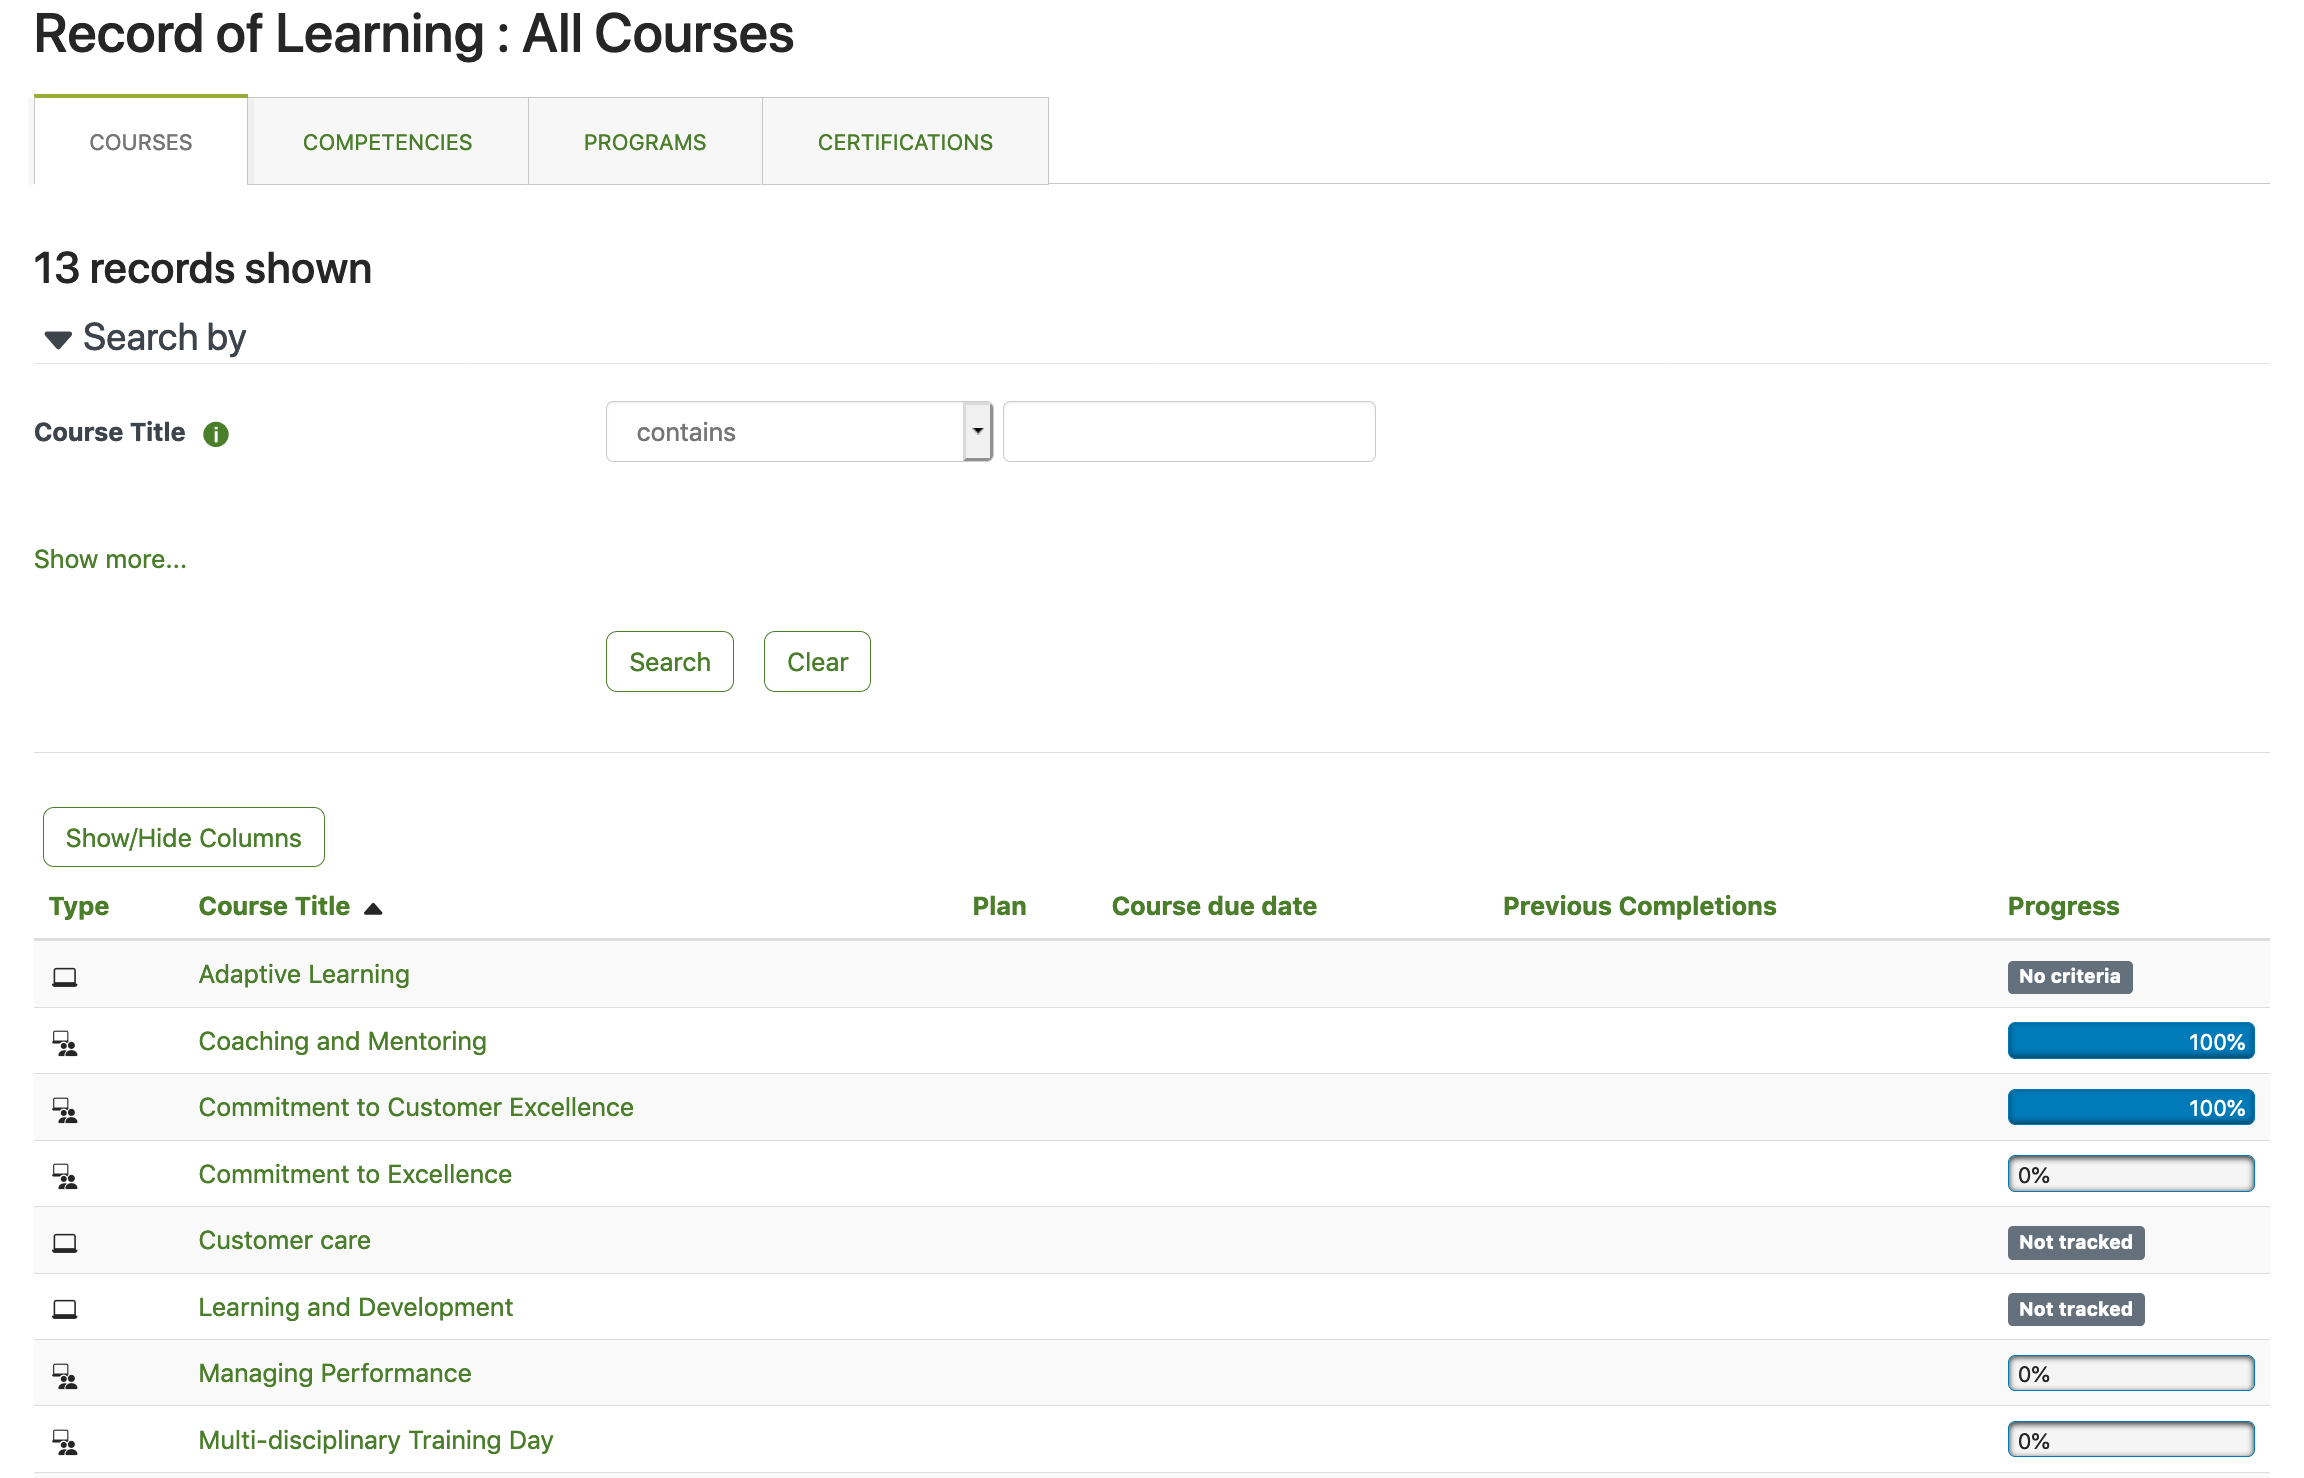
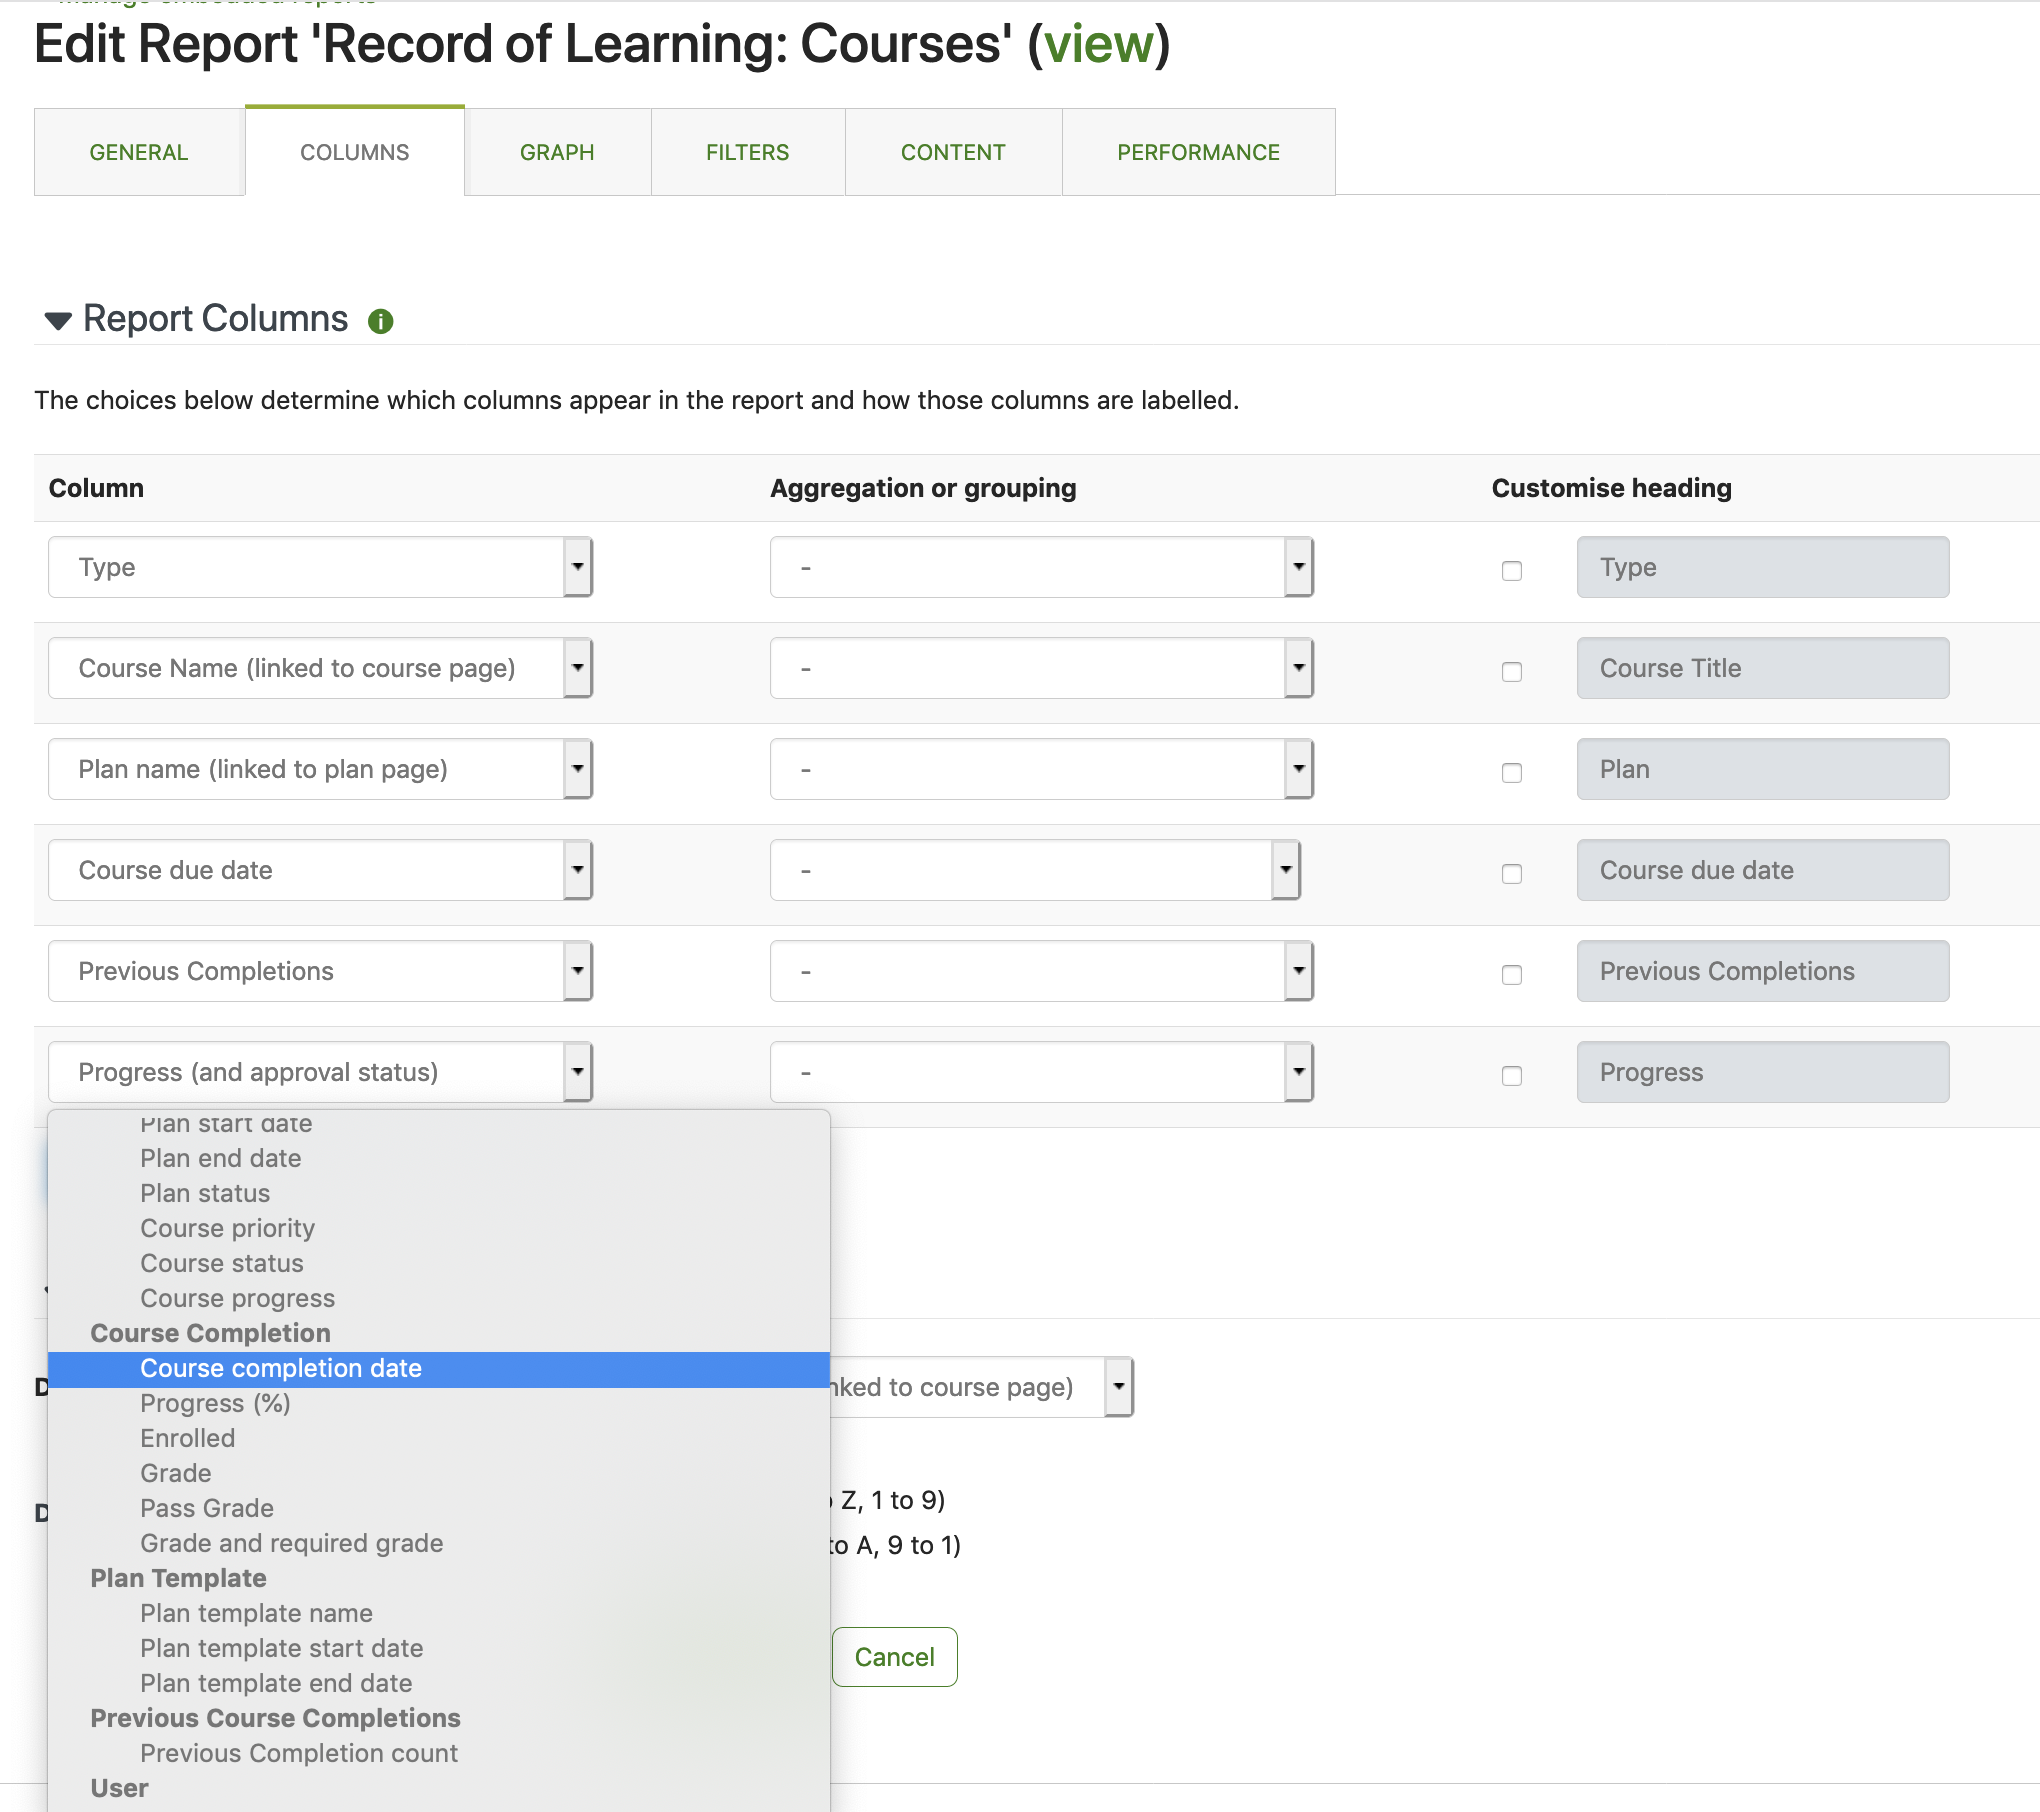
It depends mostly on the 'different stats per employee' you're trying to display. It sounds to me like the 'Record of Learning: Courses' report source would be a good basis for what you want to create. You can create a new report using this source, edit the existing Record of Learning report or (and this is the option I recommend), take a copy/clone of the RoL report and then edit from there.

To restrict the data to for each user, go to the Content tab when editing and ensure 'Show records based on user' is selected. You'll also need to allow Access to Learners or Authenticated Users.

In terms of graphing statistics, remember with the graphing tool, you need numerical data (counts, sums, averages, grade etc). Data already reported in percentages (like Progress %) is often already visualised so can't be added to this report as a graphing data point. Remember also to check your 'Aggregation of grouping' option against each column of your report.
If you haven't done so already, I'd check out the help docs on reports- https://help.totaralearning.com/display/TH12/Report+builder and the Academy content on reporting is excellent (plus we have both v12 and v13 covered!)
Cheers,
Meredith
PS - If you manage to create something super pretty, we'd love to see it! If you can share without exposing any user data, the team here are always excited to see what our users create :)

