Totara Learn Open Discussions

Change color of specific column from a graph

 
lmsanti
Change color of specific column from a graph
lmsanti 发表于 2022年05月5日 Thursday 19:08
 

I have this report, gives me how many users have completed specific coursesreport

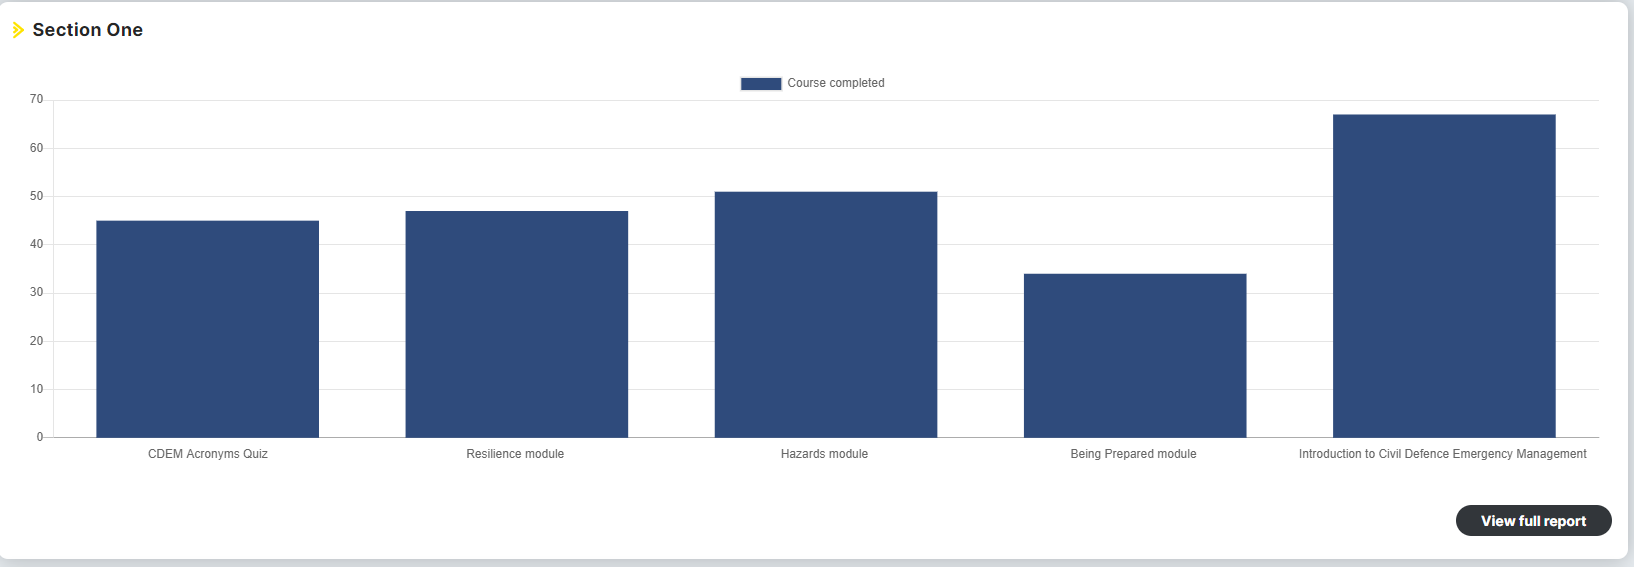
I can change the color without problems

but I want to know if I can change the color of each column
each column represents each different course

try this but it doesn't work

{"colors" : [
"#003f5c",
"#2f4b7c",
"#665191",
"#a05195",
"#d45087",
"#f95d6a",
"#ff7c43",
"#ffa600"
]}


and I can not find here

Advanced settings - Public developer documentation - Totara Help (totaralearning.com)

Craig Eves
Re: Change color of specific column from a graph
Eves (Totara Support)Craig 发表于 2022年05月19日 Thursday 20:12
小组 Totara

Hi Gaspar

The changing of colors has been applied but there is only have one dataset (data series). If you counted completion and non completions for courses then each count would have a different colour applied.

Regards