Hi,
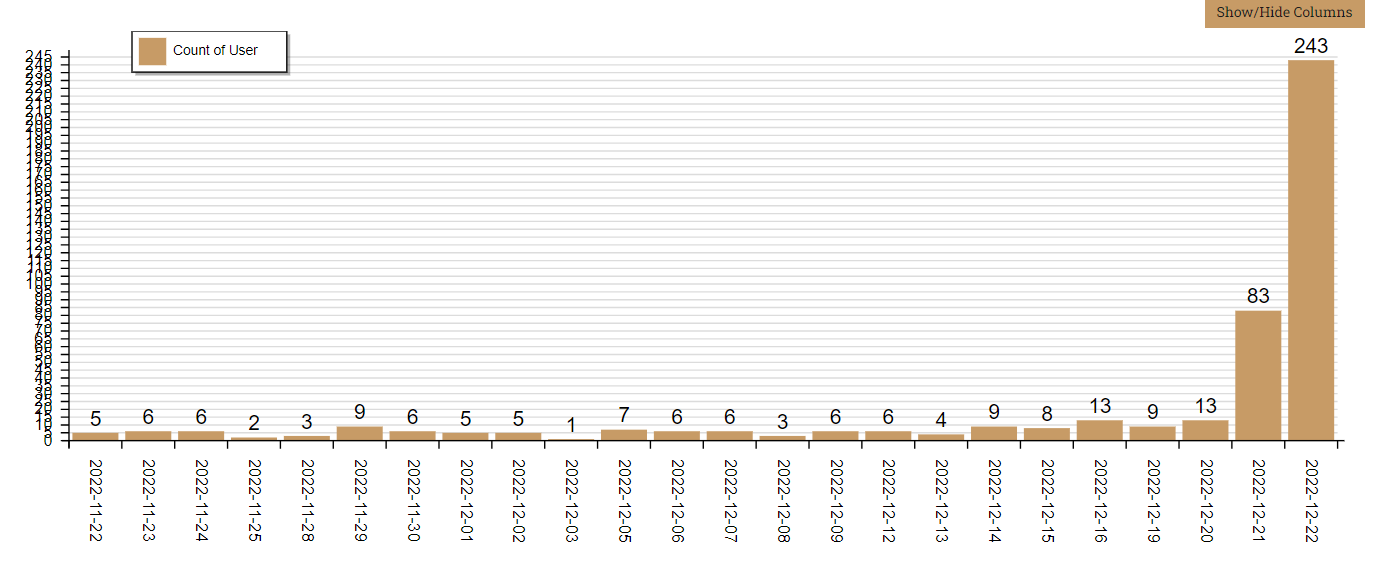
I have created a graph report that show the number of unique users logged in daily over the last 31 days.
However, the report graph block is not showing all columns/ utilising the width of the region.
Does anyone know how to fix this?
Thanks
Jennifer

