Hi
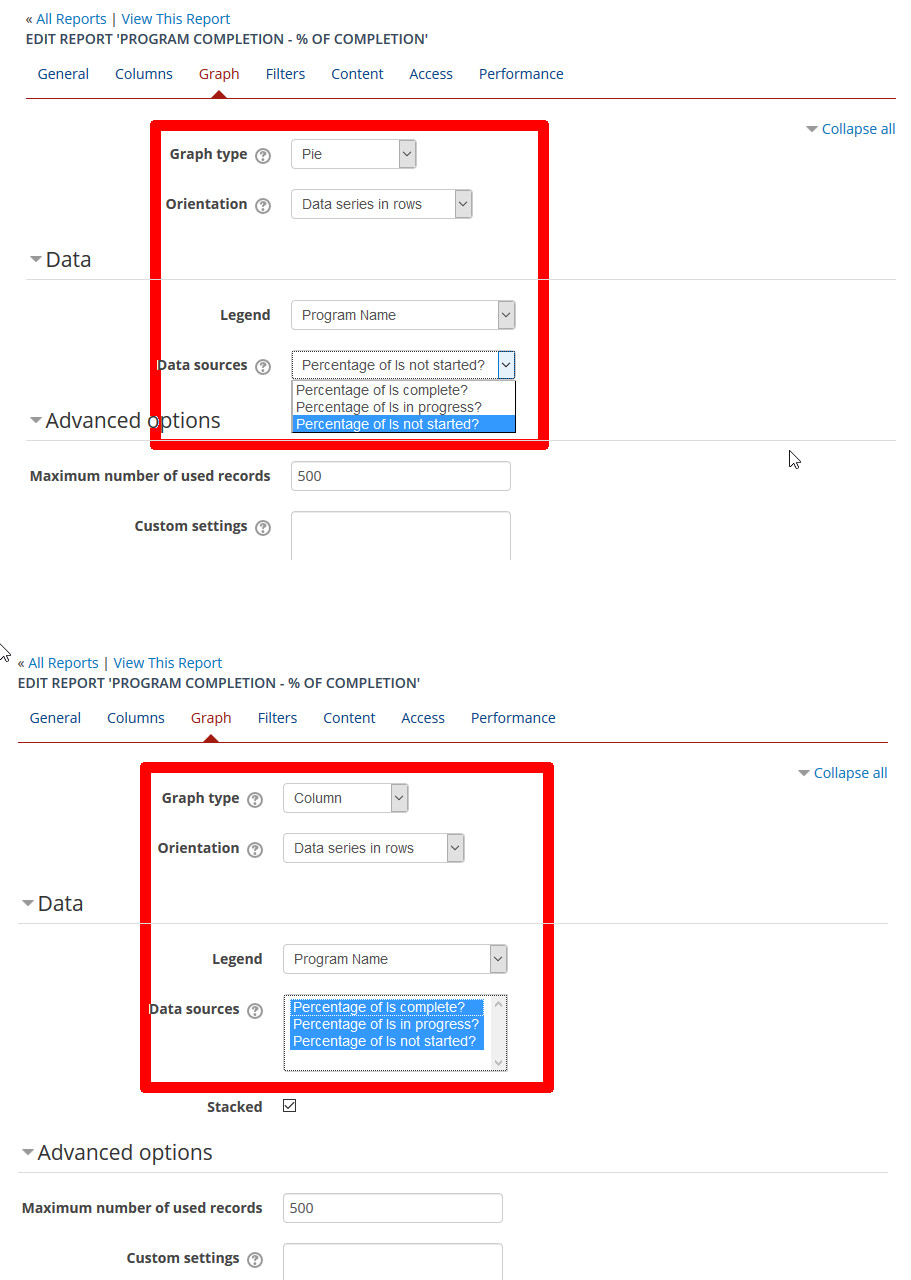
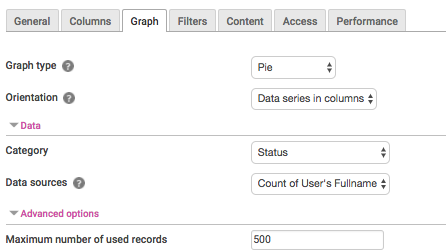
I can select various data sources in the report graph type column but in the report graph type pie I can only select one source (cf. picture)
is there a way to select various data sources in the report graph pie?
thank you
Hi
I can select various data sources in the report graph type column but in the report graph type pie I can only select one source (cf. picture)
is there a way to select various data sources in the report graph pie?
thank you
Hi LV
I think this is by design - a pie chart only uses one data series and shows the amount compared to the total for the data series.
regards
Thank you Craig
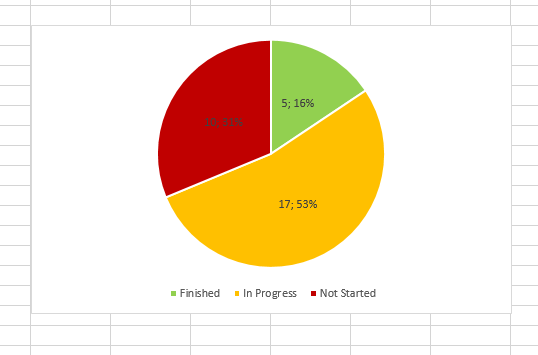
So how can I do to build a report to obtain a pie like this one (cf. image) based on the Program Completion Source (or maybe based on other source) with this datas: is complete, is not started and in progress ?
Hi Laurent,
You can do this by creating a report using course completition source.
You could set columns such as course name, is complete, is in progress and is not yet started.
Best regards,
Jussi
Sorry, should read the thread before answering - just noticed that this was already the path you have discussed with Craig - and the problem is the pie chart. Well, interesting to see what Craig says but you can illustrate the information you intended with the totara "stack" chart.
However, I must admit we use excel for all reporting mainly because we cannot use our organisation information. Our stucture is longer than hundred characters.
Thank you, Jussi I've made some good stacked column graphs but in our office we like pie charts too.
Thanks for raising this issue. Graphs are interesting for us too even we are not activile using them.
In many cases we would like to filter the results and prevent the user to access anything else but his/her slice of organisation data.
How do you make the graph available in your office?
Best regards,
Jussi
Well that's our next step; filters and access!
We are building this graphs for our managers using their specific dashboard, but we are starting with that stuff and still thinking about.
regards
laurent
Hello Laurent,
Thanks for your reply.
Have you tried report graph block with saved (scheduled) report?
It would be great to learn from your experiences - we have so little time for Totara admin work and so many promising ideas to look at. If you want to discuss confidentially you can mail me jussi.tuominen@adlearning.com
Best regards,
Jussi
No we have not tried report graph block with saved (scheduled) report. It sounds good. I'll try this week
Hi,
Here's just a quick example how to add this as report graph block into manager's dashboard.
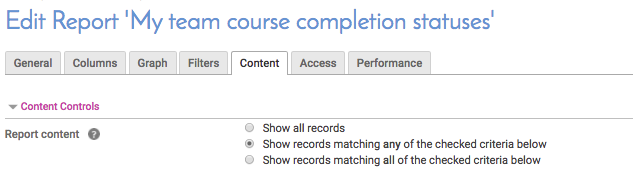
1. When you have first created report and report pie graph, then go to Content tab:
Select Content Controls > "Any" or "All" - depending on your reporting needs.
Depending on your needs, select here Show by the user's current organisation...
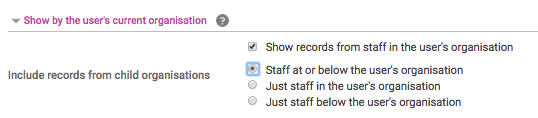
...or Show by the user:
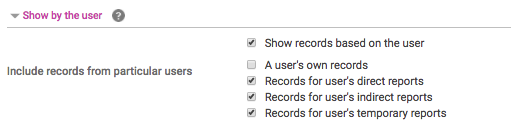
You can also add more controls e.g. "Show records based on the completion date" > "The current financial year".
Save changes.
2. Then go to Access tab and select role(s) - here I just select Staff manager. Save changes.

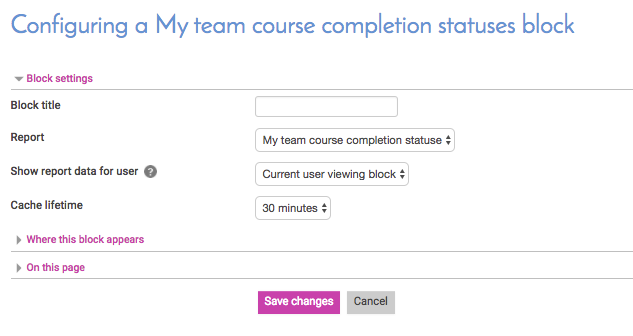
3. Go to Dashboard and add Report graph block, then select report & save.
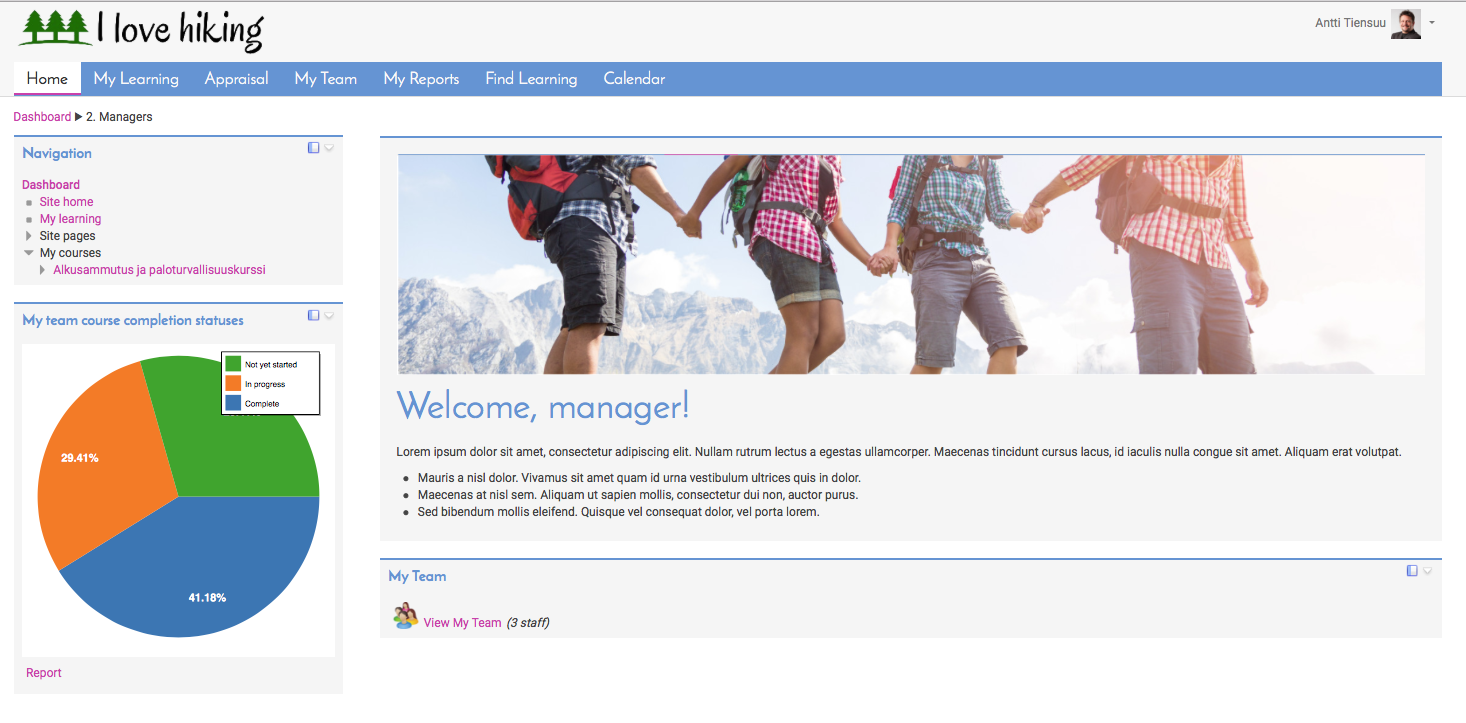
4. Login as a manager - use a test account with direct reports or use Login as User. Here's what it looks like:
Cheers,
Jani
Hi Laurent,
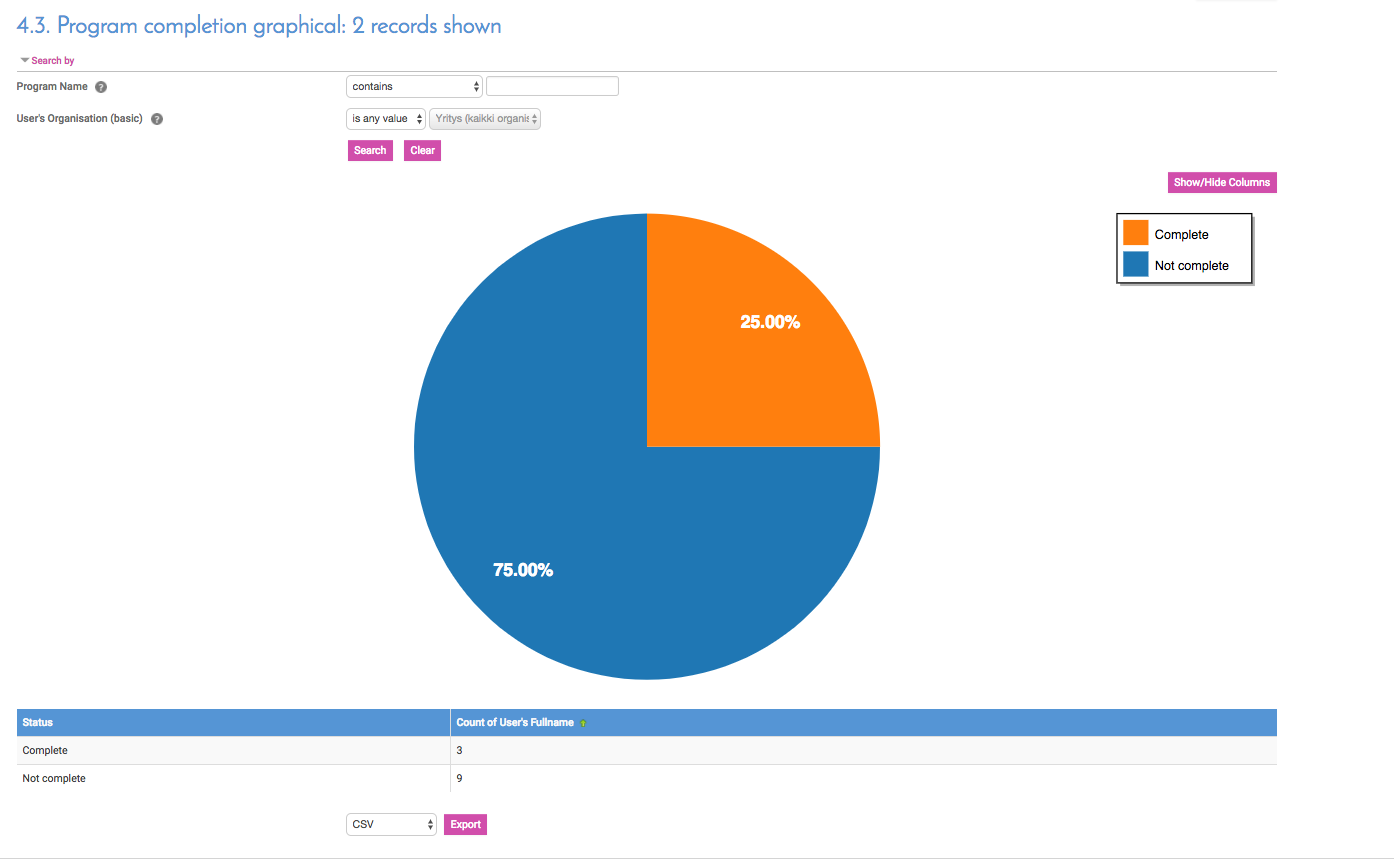
Here's example:
Report source: program completion.
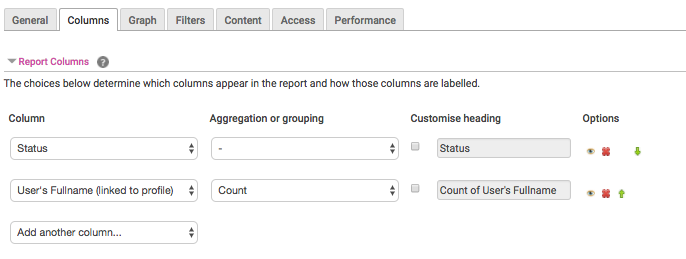
1. Set report Columns as shown below...
2 ...and graph settings:
Result is here - note there is User's Organisation as a Filter.
Regards,
Jani
Great! I'm using so "user id number" + "count unique" instead of "user fullname" it works great thank you
missed this "status" field
Thanks!
This is good stuff - thanks Jani!
Hi Laurent,
I've taken the liberty of upgrading your self-registered Totara Community account to that of a Subscriber.
cheers,
George.
Great thank you!