Hi Ira,
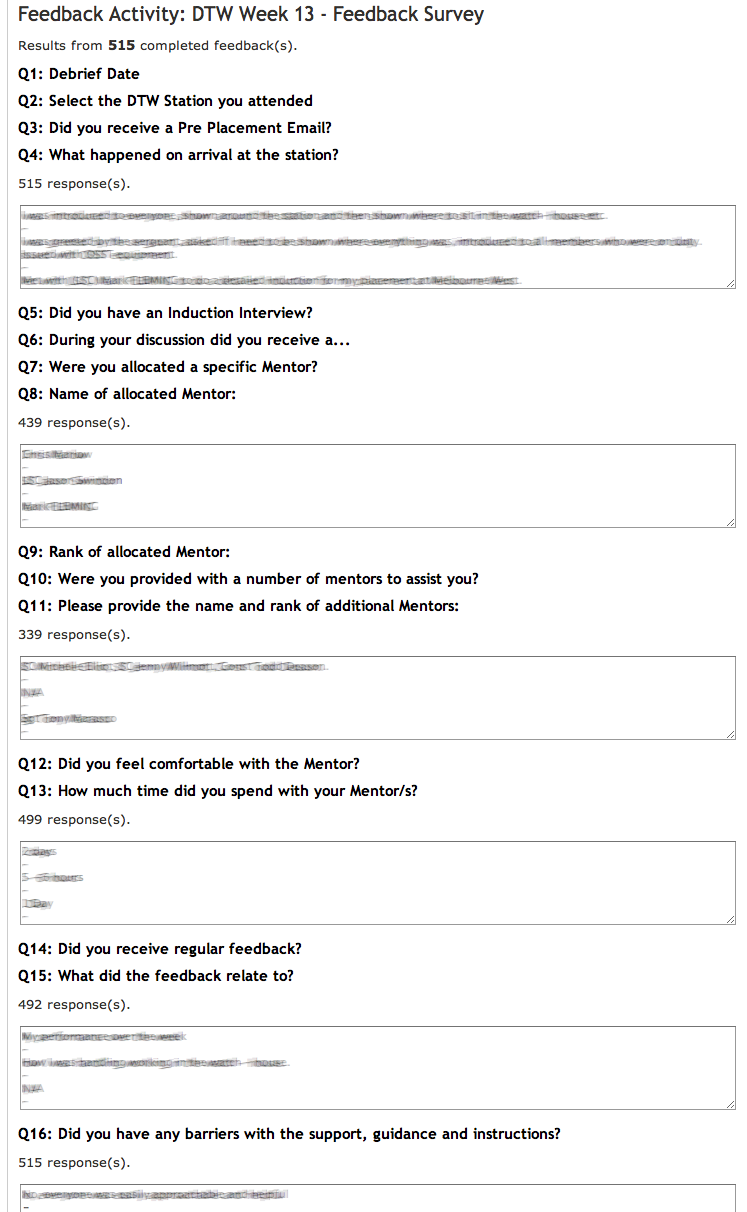
I think most of that functionality actually made it into Totara. The difficulity with it is that in order to aggregate the data into a report, every course has to use the same set of questions, and the system needs some way of identifing what feedbacks to include and which set of questions to use.
This was implemented using 'activity groups' and course tags. So to set things up:
1. Create a feedback activity that uses the same questions across multiple courses
2. Enable course tags, and tag all the courses with the same tag
3. Go to Reports > Report Builder > Activity Groups and create a new group. You'll need to select the tag from 2. and also choose one feedback activity to be the one that the system treats as "representative" of the whole group. If a question doesn't appear in the "representative" activity it won't show up in the report.
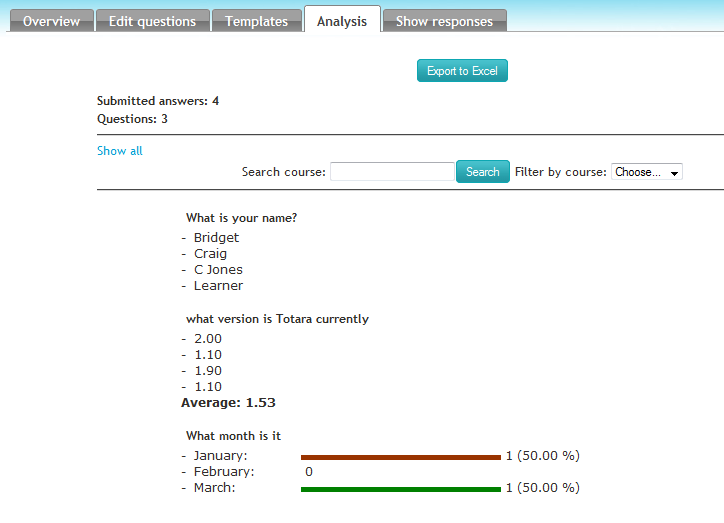
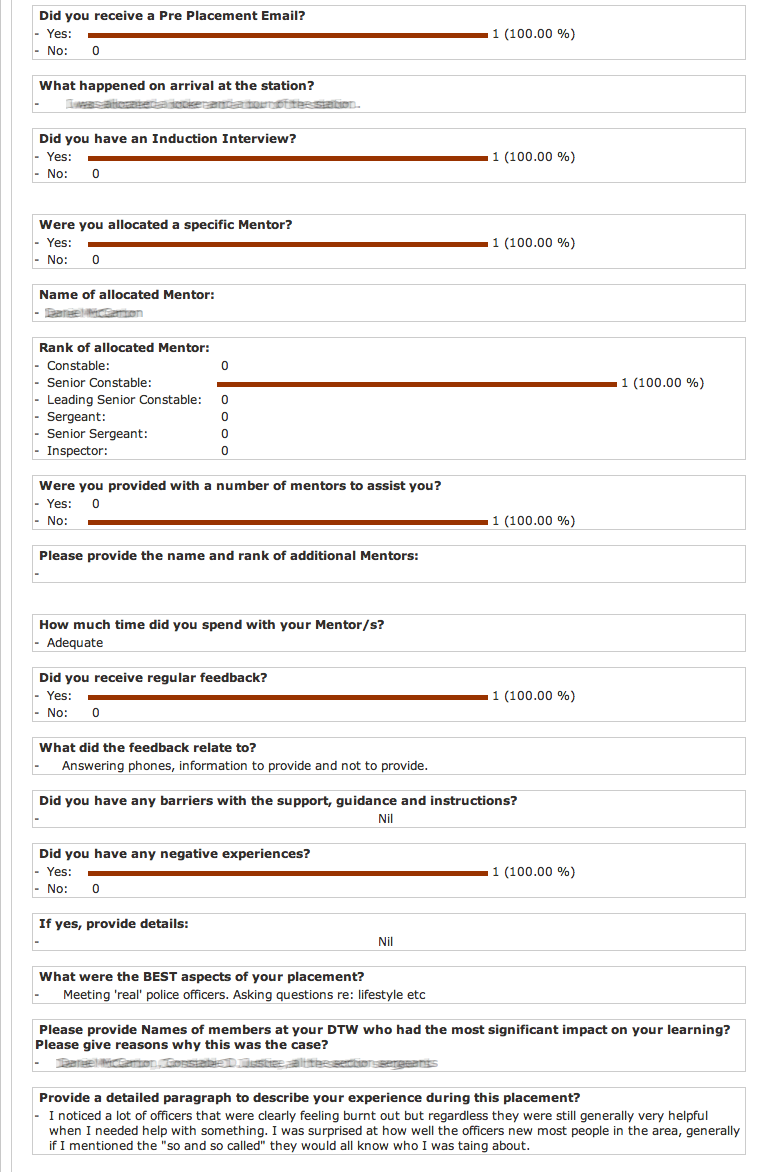
4. Once you've done that, you should see a couple of new report sources appear on the Manage Reports page, Feedback Questions and Graphical Feedback Questions. You'll get one of each source for every activity group you define
5. Creating a graphical report based should give you something similar to what Austen has in his slide.
6. You may need to run the cron a couple of times get the results to actually appear.
I'm not 100% sure this functionality all works in Totara as it's not really been fully tested, but you could give it a go and see if it works for you.
Good luck!
Simon