Best practice forum (Archived)

Slow page load performace

 
Fraser Nevett
Slow page load performace
by Fraser Nevett - Tuesday, 17 September 2013, 2:32 AM
 

I am new to Totara and have been installing our recently purchased copy Totara on a fresh server. It seems to work, but I am getting much slower performance than I would have expected.

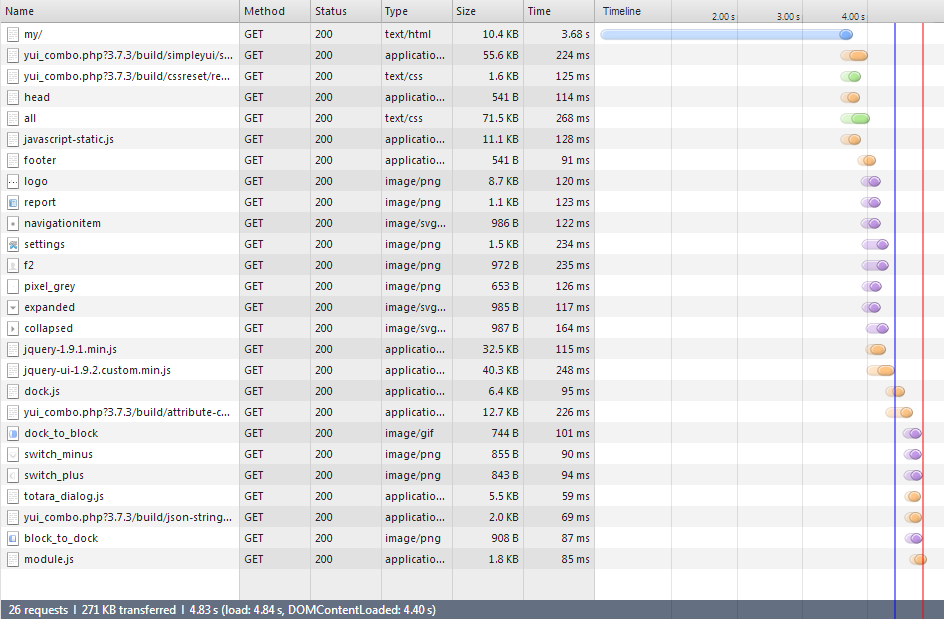
I have not yet added any content or users, so I would expect it to be pretty snappy. However, it takes 1.5+ seconds to load each page as I navigate. See attached network timing from Chrome showing the issue.

I have run ApacheBench on the server directly which shows the same issue, so would indicate it is a server rather than a network issue:

This is ApacheBench, Version 2.3 <$Revision: 655654 $>
Copyright 1996 Adam Twiss, Zeus Technology Ltd, http://www.zeustech.net/
Licensed to The Apache Software Foundation, http://www.apache.org/

Benchmarking totara-test.example.com (be patient).....done


Server Software: Apache/2.2.15
Server Hostname: totara-test.example.com
Server Port: 80

Document Path: /my/
Document Length: 106569 bytes

Concurrency Level: 1
Time taken for tests: 1.569 seconds
Complete requests: 1
Failed requests: 0
Write errors: 0
Total transferred: 107021 bytes
HTML transferred: 106569 bytes
Requests per second: 0.64 [#/sec] (mean)
Time per request: 1569.418 [ms] (mean)
Time per request: 1569.418 [ms] (mean, across all concurrent requests)
Transfer rate: 66.59 [Kbytes/sec] received

Connection Times (ms)
min mean[+/-sd] median max
Connect: 0 0 0.0 0 0
Processing: 1569 1569 0.0 1569 1569
Waiting: 1323 1323 0.0 1323 1323
Total: 1569 1569 0.0 1569 1569

The server is a single Rackspace Cloud instance (1GB RAM, 2GHz vCPU), running:

  • CentOS 6.4
  • Apache 2.2.15
  • PHP 5.3.3
  • MySQL 5.1.69

I have enabled memcache for caching, but that doesn't seem to have made a difference.

I have enabled MySQL query caching and used mysqltuner.pl to tweak other options, but again this has not helped the Totara page load times.

Firstly, could someone confirm that these load times are unusual? I would expect maybe a few hundred milliseconds -- is that reasonable?

Secondly, does anyone have ideas of what I could try next? Is there a diagnostics mode or tool I could use to locate the bottleneck that is causing the slowness?

Many thanks,

Fraser


me
Re: Slow page load performace
by George Angus - Wednesday, 18 September 2013, 3:09 PM
Group Totara

Hi Fraser,

We tested this on our set-up on the Sandpit site and everything was fine. Have you looked at the Technical Spec here:

http://help.totaralms.com/Technical_Specification.htm

Perhaps another subscriber could offer assistance based on their experience?

regards,

George.

Fraser Nevett
Re: Slow page load performace
by Fraser Nevett - Thursday, 19 September 2013, 8:21 AM
 

I have made some progress with my own investigation...

I had installed the APC PHP accellerator, but it's default memory allocation was not sufficient for Totara. I increased the apc.shm_size setting from 64M to 128M, which increased performance slightly.

I also turned on PHP's Xdebug feature and then used webgrind to analyse the results. It turned out that ~60% of the time was being spent running the settings_navigation->load_administration_settings code.

It seems that the code which creates the admin navigation menu that is slow. I tried creating and logging in as a non-admin user and that gave me much better page speeds.

Other relatively slow bits of code seem to be that which processes the plugins and that which gets the list of available timezones. I haven't yet investigated why this code is so slow.

For non-admin users, I'm now getting sub-half-second response times, which seems fine.

Fraser

David Curry (Core Developer)
Re: Slow page load performace
by David Curry (Core Developer) - Thursday, 19 September 2013, 7:37 PM
Group Totara

Hey Fraiser,

Do you mind me asking what version of Totara you are on? I ran ApacheBench myself and got similar results the first time, but after that the universal cache kicked in and I started getting much better results. more on the universal cache can be found here http://docs.moodle.org/dev/The_Moodle_Universal_Cache_%28MUC%29

My first benchmark looked much the same as yours
Benchmarking 192.168.2.110 (be patient).....done


Server Software:        Apache/2.2.22
Server Hostname:        192.168.2.110
Server Port:            80

Document Path:          /2_4/admin/index.php
Document Length:        28425 bytes

Concurrency Level:      1
Time taken for tests:   1.218 seconds
Complete requests:      1
Failed requests:        0
Write errors:           0
Total transferred:      29062 bytes
HTML transferred:       28425 bytes
Requests per second:    0.82 [#/sec] (mean)
Time per request:       1217.865 [ms] (mean)
Time per request:       1217.865 [ms] (mean, across all concurrent requests)
Transfer rate:          23.30 [Kbytes/sec] received

Connection Times (ms)
              min  mean[+/-sd] median   max
Connect:        0    0   0.0      0       0
Processing:  1218 1218   0.0   1218    1218
Waiting:     1193 1193   0.0   1193    1193
Total:       1218 1218   0.0   1218    1218


But my second run, after the cache kicked in
Benchmarking 192.168.2.110 (be patient).....done


Server Software:        Apache/2.2.22
Server Hostname:        192.168.2.110
Server Port:            80

Document Path:          /2_4/admin/index.php
Document Length:        569 bytes

Concurrency Level:      1
Time taken for tests:   2.702 seconds
Complete requests:      15
Failed requests:        0
Write errors:           0
Non-2xx responses:      15
Total transferred:      15675 bytes
HTML transferred:       8535 bytes
Requests per second:    5.55 [#/sec] (mean)
Time per request:       180.142 [ms] (mean)
Time per request:       180.142 [ms] (mean, across all concurrent requests)
Transfer rate:          5.67 [Kbytes/sec] received

Connection Times (ms)
              min  mean[+/-sd] median   max
Connect:        0    0   0.0      0       0
Processing:   161  180  10.7    182     196
Waiting:      150  168   9.6    171     182
Total:        161  180  10.7    183     196

Perhaps you are on a version before the cache? Or possibly it isn't working properly for some other reason.

Cheers,
David

Fraser Nevett
Re: Slow page load performace
by Fraser Nevett - Friday, 20 September 2013, 2:01 AM
 

I'm using Totara 2.4.9.

The universal cache is definately working, so that doesn't seem to be the problem in my case. I have it switched to use memcached rather than the default filesystem one, as using RAM should be faster than disk. I can see from our memcached monitoring that it is storing and fetching data from the cache.

Thanks,

Fraser